Dashboard Tab
- Michael Standal
- Emma Fullilove (Deactivated)
- kristina schaeffer (Unlicensed)
Overview
The Dashboard is a view-only system health and status tool and an OPC tool. The top portion displays specific information about the status, health and performance of the ACM server. The lower portion displays data points for a given list of devices and/or ports as configured in an ACM view. The Dashboard enables viewing of information commonly provided by a separate OPC client without having to leave the configuration client.
Server Information
The top row contains four server tags.

Server: Name of the server your ACM client is connected to.
Disk Utilization: Disk usage of the server that asiData is running on. (Inverse of System Idle Time)
CPU Utilization: Percentage Process Time of the server that asiData is running on.
ACM Memory Usage: Percentage of Memory asiData is using on the server.
Using The View Information
The view area requires, at a minimum, one View object to be created. If a View object is created or removed, manually refresh the View drop-down box by clicking the refresh icon ![]() .
.
The filter drop-down will save the grid layout and any filter applied automatically to the <Last Used> entry. To store different layouts, create new ones by selecting <Save Current Layout> and clicking the save button  . It is possible to save over or update an existing layout by selecting that filter name and clicking the save button. Selecting the delete button
  will remove the filter from the list.
Note: If the selected view has more than 30 items, only the first 30 items will be displayed in the grid.
Grid Options
- Enabled Objects Only: When checked, only objects that are currently enabled will appear in the grid from the View Objects list.
- Display Custom Items Name: When checked, and if the item in the View Alias Group has an Alias Name assigned, that name will be used as the item, otherwise the item tag will be used.
- Item Per Row: When checked, only one item per row will be listed with full details of quality and last update time. When unchecked, one row per object will display with the items pivoted into columns. The item quality will be known by "bad" quality data shown in magenta and "good" quality in black.
Grid Navigation
The Dashboard uses the standard toolbar that is used on other forms in ACM but with additional options.
The .png?version=2&modificationDate=1553703779218&cacheVersion=1&api=v2) icon is used to refresh the grid. If the items in the View Alias Group or the View List are changed, it may be necessary to refresh the grid list to see the new items or objects.
icon is used to refresh the grid. If the items in the View Alias Group or the View List are changed, it may be necessary to refresh the grid list to see the new items or objects.
The  icon is to restore the grid to it's default state. It will remove any filters, grouping or column changes that have been applied.
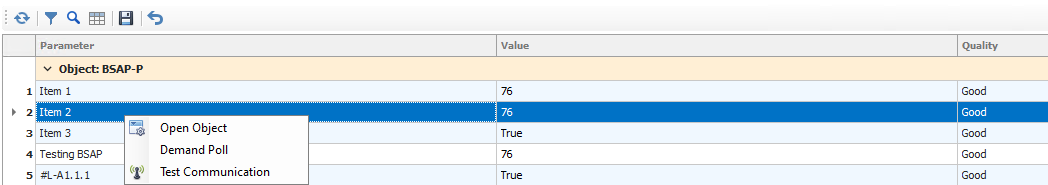
Clicking on a row or multiple rows will display the following options:
- Open Object: (only available if a single row is selected) The selected row's object will open in the Configuration Tab.
- Demand Poll: This will demand poll all selected rows. Any errors issuing the command to any Device will display in a popup grid.
- Test Communication: This will send a test communication command to all selected rows if the option is available for the object. Any errors issuing the command to any Device will display in a popup grid.
Related content
For assistance, please submit a ticket via our Support Portal, email autosol.support@autosoln.com or call 281.286.6017 to speak to a support team member.